Features
- Easy-to-Implement: Download our free JS/CSS script and effortlessly add it to your website.
- Customizable: Adjust colors, state information, and more to suit your needs.
- Responsive Design: Compatible with various devices and screen sizes.
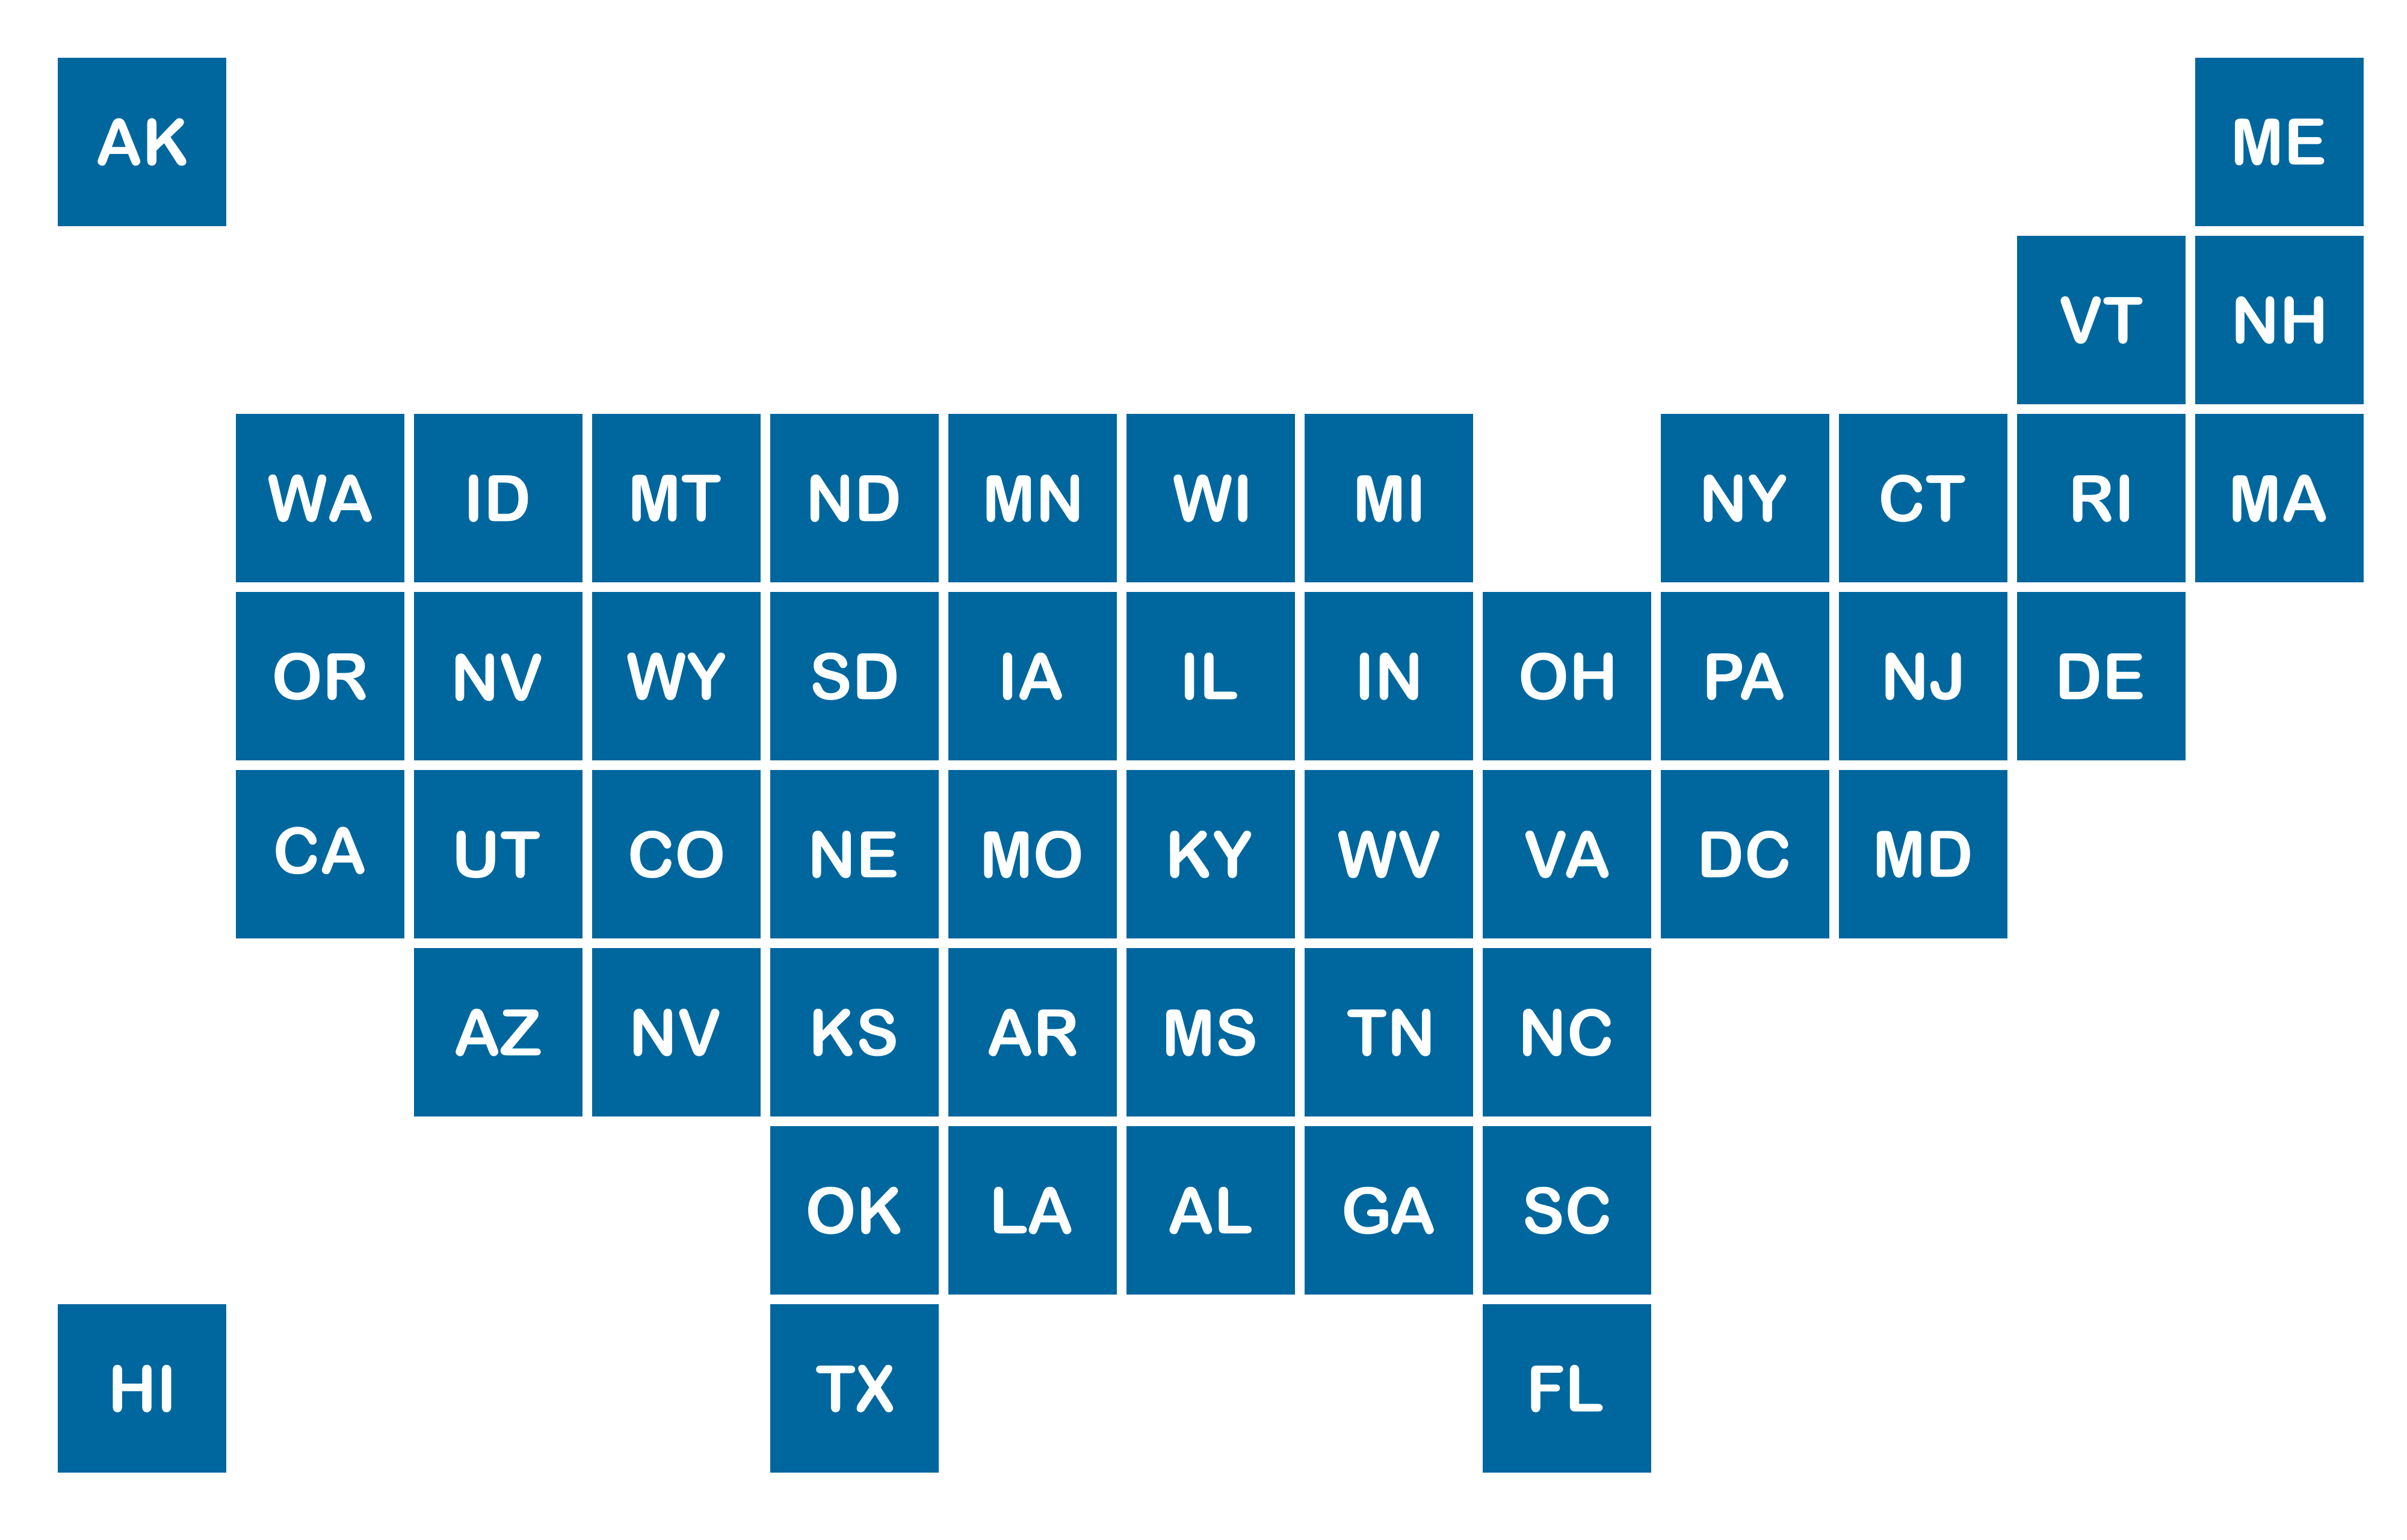
- Unique Layout: Based on the tile map design by Marc Soares, offering an improved representation of the USA.
Application Options
- Data Visualization: Present data in a visually appealing and easy-to-understand format.
- Infographics: Create stunning infographics to enhance your content and engage your audience.
- Comparative Analysis: Utilize the map for comparing various state-specific metrics, such as population density, economic indicators, or environmental data, in a visually compelling manner.