Creating Infographics with the US Map Plugin
Infographic maps and data visualization are crucial tools for drawing attention to a webpage. Regardless of the website’s topic, infographics can captivate visitors with vivid visualizations of vast amounts of data.

Introduction
The quickest way to incorporate infographics into your website is by using the US Interactive Map plugin from Fla-shop.com. We’ve developed a powerful and highly customizable tool that enables you to create an appealing interactive map with just a few clicks!
Why do people use infographic maps?
Primarily, as a corporate website owner, you’ll need to display geographically related statistical content to your visitors. For this purpose, you can use infographics. For instance, they can show:
- the number of sales in a specific US state,
- valuable information tied to different regions,
- statistical data related to your website’s theme;
Real examples from our clients:
- https://www.valchoice.com/state-insurance-information/
- http://evolutionofwork.mit.edu/the-surprising-rise-of-the-gig-economy/

Additionally, you can find practical examples of working with infographic maps here:
https://www.webdesignerdepot.com/2009/10/30-superb-examples-of-infographic-maps/
As a result, this type of visualization can convey critical information to visitors in a straightforward and efficient manner. That’s why designers worldwide adore infographics. And now, you can incorporate them into your WordPress-powered website!
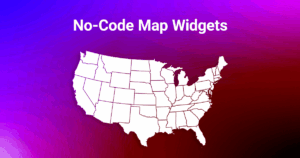
US HTML5 Interactive Map Plugin from Fla-shop.com
The US HTML5 Interactive Map plugin from Fla-shop.com is a versatile tool for adding geographically related content to various websites with diverse topics.
Regardless of the website type, be it corporate or a simple landing page, this plugin facilitates the creation of vibrant and detailed maps by adding a straightforward shortcode to a blog page or a single post.
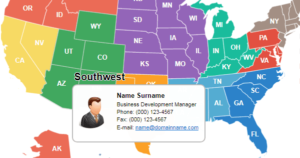
Useful Features of Our Interactive Maps Plugin for Infographics
Interactive map plugins from Fla-shop.com can assist in creating vibrant infographics through several features:
- Popup windows,
- The ability to display additional information below or to the right of the map,
- Customizable colors for each state individually,
- Customizable links and click behavior;
Furthermore, all of these features are combined with the full power of HTML5 technologies and responsive design. In addition to the geographical map of the US, a tile-based US map is also available. All of our interactive maps are installed as separate WordPress plugins. This means you don’t need extensive programming knowledge to embed infographics on your website. Simply download, install, and create!
The Advantages of Separate Plugins Over Other Solutions
Some website owners may believe that other solutions, such as iframes, Flash maps, or direct insertion of images, can be cheaper and more practical than a plugin for creating infographics. However, we caution that using these technologies is not efficient.
Flash interactive maps cannot be rendered on mobile phones and tablets, which means you may lose the most valuable visitors to your website.
Images are not customizable, so you’ll need to update them each time you decide to change some information. Iframes can significantly slow down your website’s loading speed, which is crucial for mobile users.
Separate WordPress Interactive Map plugins are free from these issues. They are fast, highly customizable, and responsive, ensuring you never lose your audience. Plus, they are easy to use.
Conclusion
In conclusion, infographics can significantly enhance the usability of your WordPress-powered website! Add them quickly and effortlessly with Interactive Maps from Fla-shop.com! Visit the plugin homepage for more information.